Thursday, May 1, 2014

ONE LAST THING

It's the end of the semester. Again. It just keeps happening this way, in that funny little way that time works. And since it's the end of the semester, it can only mean one thing. FINALS!
Finals are upon us, and in some cases, behind us. The final assignment for this Digital Foundations class was to, wait for it, document things digitally!
Oodles upon oodles of fun. Of course it is.
Luckily enough for me, I actually had a little bit of prior knowledge from working with InDesign in the past. Granted, it had been in the past, and I had forgotten most things. As a big fan of trial and error myself, I set off on a grand adventure to figure out the inner workings of this program.
After about five hours and two scratched files later I finally got the hang of it all.
First step in making this book: gather all past assignments.
Now this is harder than it looks. To begin with, you have to remember what all you managed to do in the first place. And that is a chore in and of itself. After that, you actually have to find them. Thank god we had to keep a blog.
After all those steps of one, it was just a simple matter of adding in text here, deleting everything there, crying in the corner for a bit, eating an entire box of donuts, and then BAM here we are. Like magic.
Or technology as some people call it. But we all know what it really is.

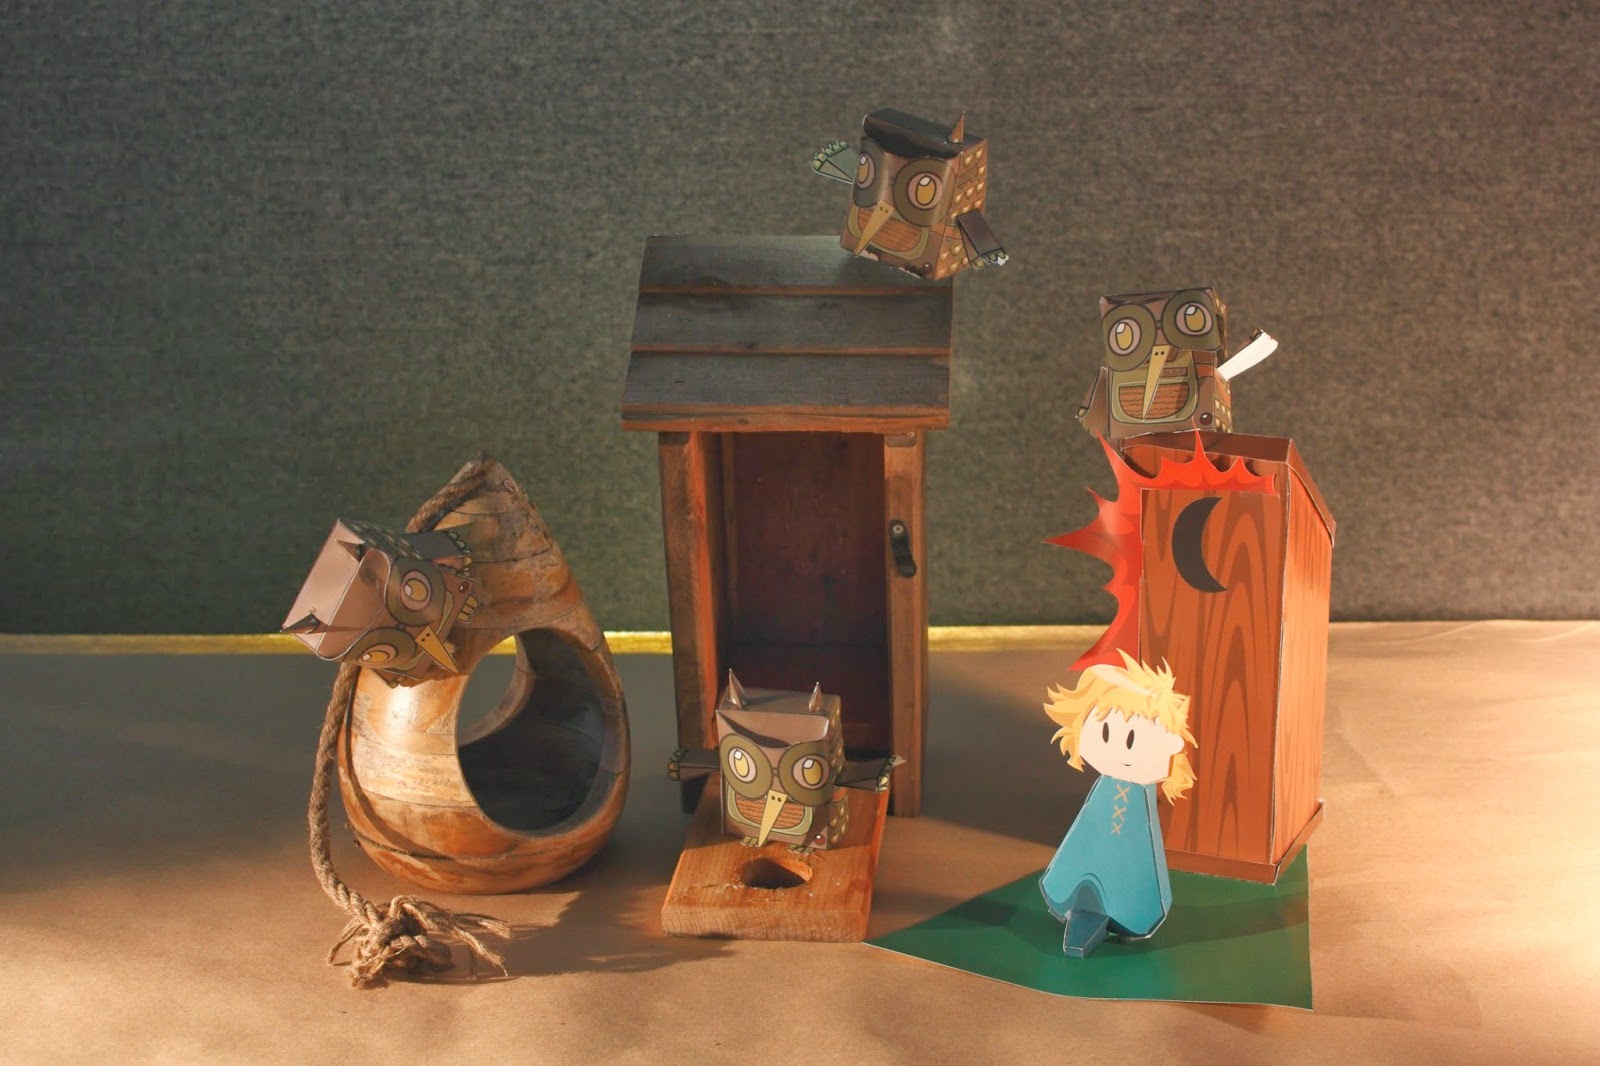
Here are some of the pages from my book:


Makin' the Photoshop things

Our last project in Digital Foundations is to do whatever we want! WhooHoo! So of course I couldn't think of anything to do right? Eventually out of necessity I decided to just go ahead and recreate my 2D final in photoshop. However, considering the fact that I had enough trouble just making one version of that project, I decided to ditch that idea.
Instead, I decided to go with something not only less time consuming, but also useful! Business cards! Are you pumped cause I'm pumped. I'm designing my very own business cards.
After having worked for a while on my final digital portfolio in InDesign, and having come up with a color scheme and layout that I was rather fond of if I do say so myself, I decided that I would make my business cards reflect that as well.
This ended up being what I came up with!

Thursday, April 10, 2014

What's in a week? Part two: critique

DID THE THING. In class we had a rather different version of critique than normal. Instead of having the entire class critique everyones project, we split off into groups of three (ok there was one group of four, but that's not important). My group included Mandie and Toonky. (psst, if you click their names, you'll end up on their blogs…) 

And so we set up a thingy that looked like this:

(++)

(+)

(o)

( - )

(- -)

The ++ being what we thought was the best thing going on in the project. O was our overall opinion on it. And -- was what needed the most improvement.

This is what mine ended up!

(++)    Organization of it was easy to follow

(+)      It was personal

(o)      Overall they seemed to like it, said it was "really nice" and colorful

( - )     The words need work. Suggestion of using hierarchy? Maybe stacking them

(- -)     Words need to be bigger


Tuesday, April 8, 2014

What's in a week? Part One:

So! Our version one's of our current project, the info graphic, was due today in class. So, here I am with my info graph, in class! Our project was to make an info graph on how we spend our time in an average week. To start out we logged in time on excel in thirty minute segments. Whatever activity we were doing in that time we put down. Since some events were not set in stone for each week, I generalized different activities as one big one. For example in mine: sleep / other/ teenage miscreant deeds is one whole section. For the visual part of it, I decided to use pages in a book to represent my time after I realized that I spend so much time reading.

I now present part one!


Thursday, April 3, 2014

P.S. have another

There's this super cool info graph of the Periodic Table of Artists I found. I love it, although one small problem I found: Van Gogh should definitely have been under miserable white men. No question.

Helvetica: A film

In preparation for working with type, we're watching Helvetica in class. These are the notes taken (I feel it only acceptable to from here on switch to Helvetica):


Fun Facts:
- First known use in early Mesopotamian civilization before 3,000 B.C.
-The terms "uppercase" and "lowercase" originated when people set print by hand. The lowercase letters were stored in the bottom, or lower case, and the uppercase letters were store right above, in the uppercase. 


Give words a certain coloring

"Graphic design is the communication network in which the way the world reaches us"
Artists have a visual disease, it's what fuels us.

Type isn't black, it's white, it's the spaces between.

We believe there are not that many good type faces.

When helvetica came about we were ready for it
1950's
 In post war period there was a feeling of idealism. The design is part of that need to rebuild and reconstruct. Sense of social responsibility. Early experiments of type.
Swiss designers really drive it along. Helvetica emerged in 1957, from a need for rational type faces that could be used for anything and could be presented in a legible way.

"Creating order is typography"
Helvetica was a real step for 19th century typeface. It got rid of the manual details in it, and it made it more neutral. There should be no meaning in itself, only in the words themselves.

Serifs on the bottoms of letters, the little feet

Swiss paid more attention to the background so that the spaces between really hold the letters. 


About the font itself:
- developed for the Haas Type Foundry by Max Miedinger and Edüard Hoffmann in 1957
- they wanted an updated sans-serif
- helvetica was originally named Neue Haas Grotesk
- Later changed to Helvetia, which is the Latin name for Switzerland, by German companies Stempel and Linotype


Helvetica was overused so much
Just because something is legible doesn't mean it communicates

Hella cool info graphics

So obviously you can see by my last post (and the title of this post) that we're doing INFO GRAPHICS(!) now, and as I was perusing the internet I stumbled across some 3D sculptural info graphs! As a sculpture major, I though these were pretty cool. I can dig these. I'd like to make a 3D info graph for mine, but alas, this is a class called "digital" foundations.
They frown upon not using computers in this class.

Here's the graphs by the way:


(psst...here's a link to where I found these…)

Tuesday, April 1, 2014

Infograaaaaphs

So. Info graphs. Pretty cool huh. Info graphs. INfo graphs. Innnnfograph. Infographinfographinfograph. info GRAPH. INFO graph. Info graph.

OK. Infographs are basically graphs that have been turned into images that represent information. These can be obvious or kinda vague. A vendiagram, for example, is an info graph. Pie charts, theres another. Or it could be something completely different, for example, this giant arrow:


See, giant arrow. Now this info graph gives us information about space and out atmospheres surrounding earth. I'm a fan of this one, primarily because there's a really big arrow. But also the varying shades of blue and the way that they used different textures to relate back to the information they're trying to convey. Pretty cool. 


Here's another one for you! As a whole, I rather like this one. It's got nice structure, it's easily readable, and it's a topic I can relate to. And it conveys info through little images, I like that. Well done.


 Here's an example on how info graphs can look like anything! In this case, our graph is a cup of coffee showing how however many shots of espresso can affect you. I like this one because there's not any black bold lines separating the different sections, they all just sit nicely side by side. Or rather, one atop the other. Now, I'd probably like this one a little more if I actually liked coffee. But that's just too bad.


Some info graphs, such as this one, utilize the cunning placement of arrows to get their point across. I'm a fan of these ones, they remind me of a maze. You've got to dedicate some time to getting from the graphics to the info. Labor, for reward. 


This is the last one I'll show you guys, and as the last one, I figured hey, let's make it educational! So here we have an info graph about allergies across the US. Out of the five I've showed you so far, this is my least favorite. Although I like the aesthetics of the circle, it's a little uncomfortable to have to crane your neck to try and get to the info on the bottom. Not a great idea there. But for the most part, I like the presentation of it. Plenty of spacing in between things, so it's not all bunched or cluttered. Props.


Tuesday, March 18, 2014

Let's find the thing: Zain7

Zain7 is the last digital artist I'll post about for now. Their work really caught my eye due to the brilliance of the colors used and the surreal sense of perspective that their pieces give.
Their pieces remind me of the fish eye lens effect. I like how the artist uses continuation of color scheme throughout a few different pieces, and their style is so distinctively intricate but at the same time soft and simple. 


Let's find the thing: Nikita Veprikov


Nikita Veprikov is a Russian digital artist, and you may recognize his work in his piece of an old witch, Old Hag

This is the piece that originally drew me to him, having found it on Tumblr and read the resulting story that was written in companion to this piece. I love how Veprikov conveys emotion and a sense of reality in an otherwise fantasy scene. 

This style of artwork is something I'd love to try my hand at. I love illustration, although I'm not the biggest fan of creating digital art myself, but it would be interesting to try.

Let's find the thing: Mistywisp

Mistywisp, a fractal artist, uses technology to create fascinating geometric fractal art. Fractal Art is a form of algorithmic art that is created by calculating fractal objects and representing these calculations as images. The designs created from this can be similar in appearance to mandalas. Fractal art is one of my favorite styles of digital art. I've been a math nerd for years, so anything geometric has always spiked my interest.

When we were first experimenting with Adobe Illustrator, I had a lot of fun with the solar flares. This kind of art strikes a similar chord in me, and I'd enjoy finding out how to make these and incorporate them into illustrative designs.

Let's find the thing: Alberto Seveso

Another one of my favorite digital artists is Alberto Seveso. I found his work during my research, and I was just taken by his combination of portraiture and abstract designs.

I really like the way that he combines organic shapes that are such vibrant colors with the soft skin tones of the woman. His inclusion of line gives the face more texture and depth, and provides a third component to the piece that balances the photo like details of the face and the bright organic shapes. 
I would love to find out how he layers the different components of this piece.


Project Passable Papery Papercraft

The third Project in my digital foundations class was actually less digital than expected. We were doing paper craft projects. However, we had to be original in our construction and layout of our figures. After some research and practice on how to put together a 3D paper object, I tried my own hand at designing a character template. But before I could start on that, I needed to come up with an idea. Unsure of wether or not I wanted to do an original humanoid character or to design a template for an animal, I started my brainstorming in my sketchbook, going through a few different character designs and exploring multiple scenarios. I knew that I wanted to design a specific scene however.
(above: possible character designs. below: end design)

After I settled on a design, I then went on to make a mock up model. Instead of relying on pre-existing designs, I started from scratch, making my templates piece by piece. 


From here I dismantled my model and scanned the flattened pieces into the computer before importing them into Adobe Illustrator. Then, I worked out a color scheme using this website. I then made a base outline in Illustrator, and from there I used the colors I had chosen to design the specifics of my character. 
This was the end result: 


Let's find the thing: Noelle Stevenson; Gingerhaze

Having spent the first half of the semester on Adobe Illustrator, we're now moving on to Photoshop! Woohoo! So, in preparation, we've been tasked to find five photoshop artists and write about them a little.

The first person I think of when I think photoshop artists is Noelle Stevenson, or as she is more commonly known online; Gingerhaze. Gingerhaze is a digital comic artist, probably best known for her drawings of The Broship of the Rings, a parody of The Lord of the Rings in which the characters are all drawn as modern day people.

(Photo from Gingerhaze) 

I was first attracted to this artist because of the subject matter and the simplicity with which she draws her characters. The very flat colors with little shading strike me as minimalist without taking away too many details. Gingerhaze also has done illustrations as well as comics, an example being a cover she did for Random House's Listening Library audio edition of The Time Machine:
(Photo from Gingerhaze) 

From this artist I hope to learn how to portray a scene without using too many details. I'd like to try my own hand at making illustrations and comics using photoshop and purely digital means.


Stop Taking Our Damn Books

If there's one thing that really fires up my bases, its the topic of banned books. Why would you ban books? Books are wonderful things, things of knowledge and wonder and magic. Growing up, I was in trouble a lot, but the one thing my parents swore never to take from me was my books. Books are just so important, and banning books is one of the stupidest things I can imagine happening. Either way, it happens.
People also seem to not be very aware of banned books. It's not really a topic that enrages people (even though it should) or captures people's attention. So when we were given instruction to design something for any issue we wanted, I knew that banned books was the one.
After having chosen my issue, I had to come up with a way to portray it. I knew I didn't want to do something cliche such as books with chains around them. I started with researching lists of banned books. But the list of banned books is massive. Name a classic, and it's most likely been banned somewhere. So I had to narrow it down. I went with banned books that I had read myself. Well, that narrowed it down some, but it was still a pretty large list. I started brainstorming key symbols and images from each book, and ended up with another list, but of images. After that I worked on incorporating as many as I could into a scene. Eventually I ended up with this:
(version one)

In this first version, I only managed to incorporate three different banned books, only one of which was easily identifiable. The leaves and tree are supposed to represent both Leaves of Grass and Gone with the Wind, while the girl is supposed to Alice, and therefore Alice's Adventures in Wonderland.

I fixed a couple things, such as the background color and I added a bright red letter "A" to Alice's dress to symbolize A Scarlett Letter by Nathaniel Hawthorne. In the end I had two copies, one kid friendly and another uncensored one. 
(above: Kid friendly. below: uncensored)


Tuesday, February 18, 2014

Self Portrait from hell

For our first project using Adobe Illustrator, we were assigned to make a self portrait entirely out of squares (or rectangles, any quadrilateral for that matter.) Everyone in the class opened Photo Booth and from there we spent a rather excessively unnecessary but fun time taking selfies. Our goal was to use a photo that best describes us so, I thought what better pose than me falling out of my chair clinging to the table for dear life.
Starting out, it went really well. Until I went overboard and dug myself into a deep deep hole. I had made it too complicated, and the file size was getting too large. Adobe started crashing, I started saving every fifteen minutes, and then every ten, until it was so large it actually took ten minutes to save. After about 27 hours, six exports to jpeg and reimports back into Illustrator, this is what I ended with:


I feel that I could have adjusted the table a bit more, but it is what it is.
Here's some details to show the actual squares:

Tuesday, January 28, 2014

"The whole is greater than the sum of the parts"

At a first glance, this quote describing Gestalt's principles sounds a bit like a load of bull. How can the whole be bigger than everything added together? Gestalt, you're drunk, go home.

But this principle does make sense, in a strange "what is my brain doing" kind of way. A little bit of "whoa man, brains are insane" in there too. We've all seen examples of this principle, but we just may not have know what it was. For example, when you think you see a face in the dents of a carton of chocolate milk, or in the folds of a hanging pair of pants. While unintentional, these are both examples of the principle of closure.

Tom Friedman's hanging sculpture Open Black Box is another example of closure.
By using the angles of the corners to show the limitations of the 'box' Friedman creates a cube. The points coming off each piece direct your eye to the one parallel to it. He has eight different parts to the sculpture, but because of the gestalt principles we see it as one object.